
Visualization
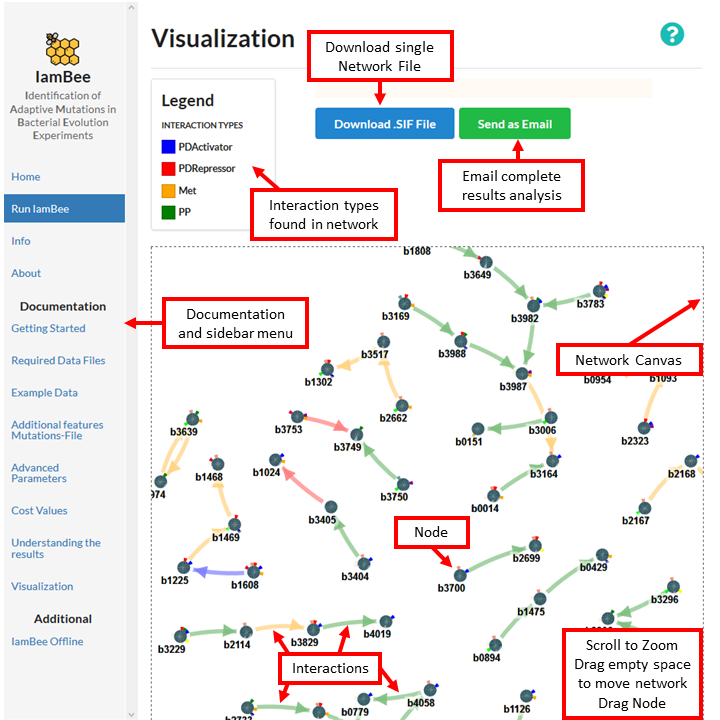
The inferred sub-network can be visualized using the online tool by clicking the Visualize Results button on the results page.
By default the resulting network displayed in the visualization is a merge of the results obtained by the selection sweep on the edge cost. If you prefer to have the subnetwork visualized for one particular edge cost you can rerun the algorithm with a fixed cost parameter.
Understanding the Visualization
The inferred sub-network is visualized by drawing the genes/gene products as dots or nodes and the interactions as edges. The canvas containing the final network is delineated by a dash line, you can zoom in and out using the mouse wheel is the equivalent in touch-pad.
Additionally, to drag the whole network you can click an empty space in the canvas, hold and move to the desired point. Similarly, each of the nodes can be moved by clicking on the node, holding and dragging the node to the desired point.
Nodes
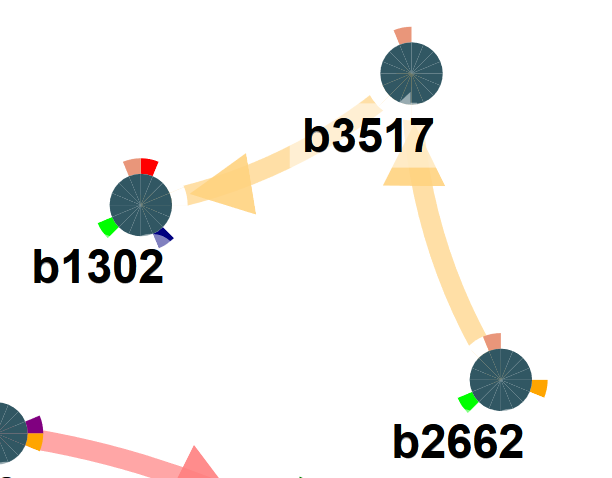
The nodes correspond to genes present in the selected sub-network. Each node has an outer pie circle with a number of subdivisions, corresponding to the number of populations (each indicated with a different color). If the subdivision is colored that means the gene was observed to be mutated in the population represented by the color.
So nodes that have the same color code in one of the divisions are mutated in the same population.
Edges
The edges in the network visualization are colored according to the interaction type they represent (see legend). Interaction types are as defined in the interactions defined in the network file and present in the inferred sub-network are observable as arrows connecting nodes. If the directionality of the edge is provided in the interaction file this is indicated by an arrowed edge.The color of the edge represents the function of the interaction as explained in the legend.
The edge width depicts the ‘reliability’ of an edge or degree of belief we have the edge is involved in the adaptive phenotype. The larger r=the width, the more likely the edge is involved. The edge width is derived from the parameter sweep over the cost as explained in the extended help file. In general edges that are recovered at a stringent edge cost will also be found at less stringent edge costs. These edges are most supported by the data and hence most reliable. This property is reflected by assigning a weight to the edges based on the maximum edge cost for which they are still included in an optimal sub-network. More reliable edges will have a smaller width.
If the run was obtained for a single edge costs, edges will not be weighted.