Tutorial
Best Practices
When you start running IAMBEE what you should know:
- IAMBEE exploits parallel evolution to distinguish drivers from passengers.
- It searches on an interaction network for sets of connected genes that are frequently mutated across a set of independently evolved populations.
- These connected gene sets are proxies of adaptive pathways.
Whether the algorithm will be able to identify these adaptive pathways and will be able to successfully distinguish the drivers from the passengers depends on:
- The size of the network used as prior scaffold. If the network prior is large and contains many edges the chance is higher that genes with spurious mutations will start connecting to true sub-networks (referred to as clusters of mutations by the reviewer). Start IAMBEE with a rather curated network (less than 20000 edges for yeast or bacteria).
- The assumption of the network approach is that hitchhiking or other spurious mutations will be less connected to driver mutations than driver mutations would be connected to each other in the network. The network connectivity is a way to distinguish drivers from passengers. However, if the ratio of passengers to drivers is high (in an unfiltered input list), the chance that passenger mutations (spurious mutations) will connect spuriously to driver clusters is higher. That is why it is important to use, in case many mutations occur per population the additional information on the impact score of the mutations and on the frequency increase of the mutations during a selective sweep. This additional information performs an implicit weighting of the mutations when searching for paths that connect mutated genes and helps avoiding spurious paths.
Here we provide two case studies that show step by step how to run IAMBEE and how to interpret its results.
Case study 1: Analysis of data from an evolution experiment in E. coli
Below IAMBEE is run with the default settings using the E.coli case study using information on the functional impact scores, frequency increase of the mutation during a selective sweep and compensation for mutator phenotypes. In the runs below only genes with non-synonymous mutations were considered.
The dataset consists of 16 independent evolved populations. The interaction network of E. coli is the network used in the study of Swings et al which can be downloaded from the tab "Download Networks". The network contains high confident edges only (about 16000 edges). A curated network helps keeping the computational times reasonable and avoids prioritizing spurious genes (passengers that get connected by chance to the true adaptive genes).
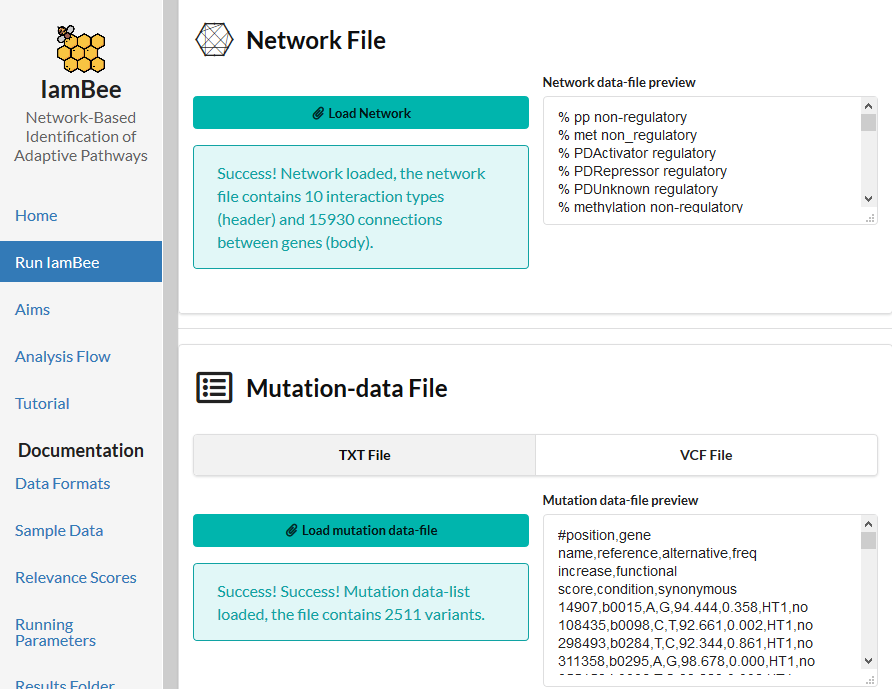
The experiment contains populations with a mutator phenotype i.e. some populations have an aberrantly high mutation frequency. Because these populations carry so many mutations, they are less informative in pinpointing the correct driver mutations. So we want the contribution of the mutations occurring in such frequently mutated populations to have a lower impact on the analysis and on hence on the distinction between drivers and passengers. To down weight the impact of mutated genes occurring in mutator populations we switch on the slide "correction for mutation rate". We also use information on the functional impact scores, the frequency increase of the mutation during a selective sweep.
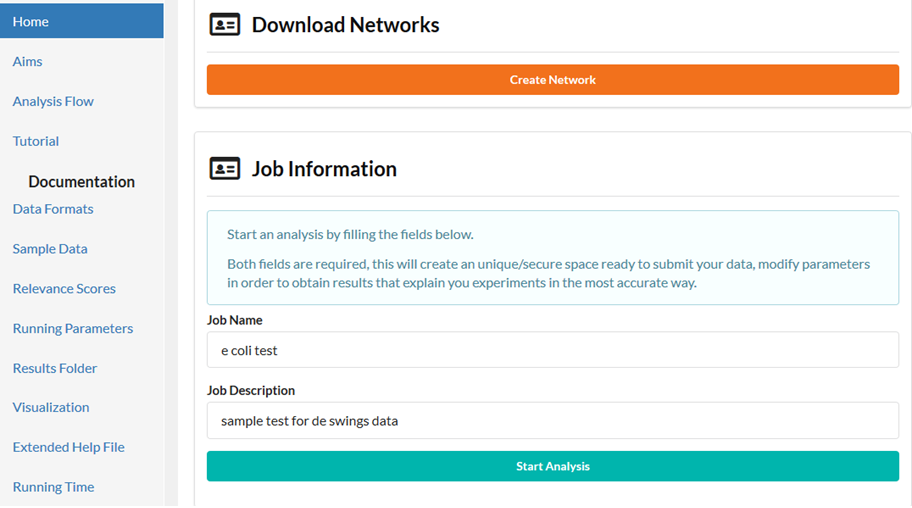
In the form upload the network file and the mutation file and the Gene Names file. If you want to close your browser after submitting the job do not forget to provide your email address. Results will be sent to you as soon as the run finishes (runs will automatically aborted if no results have been obtained after 48 h).

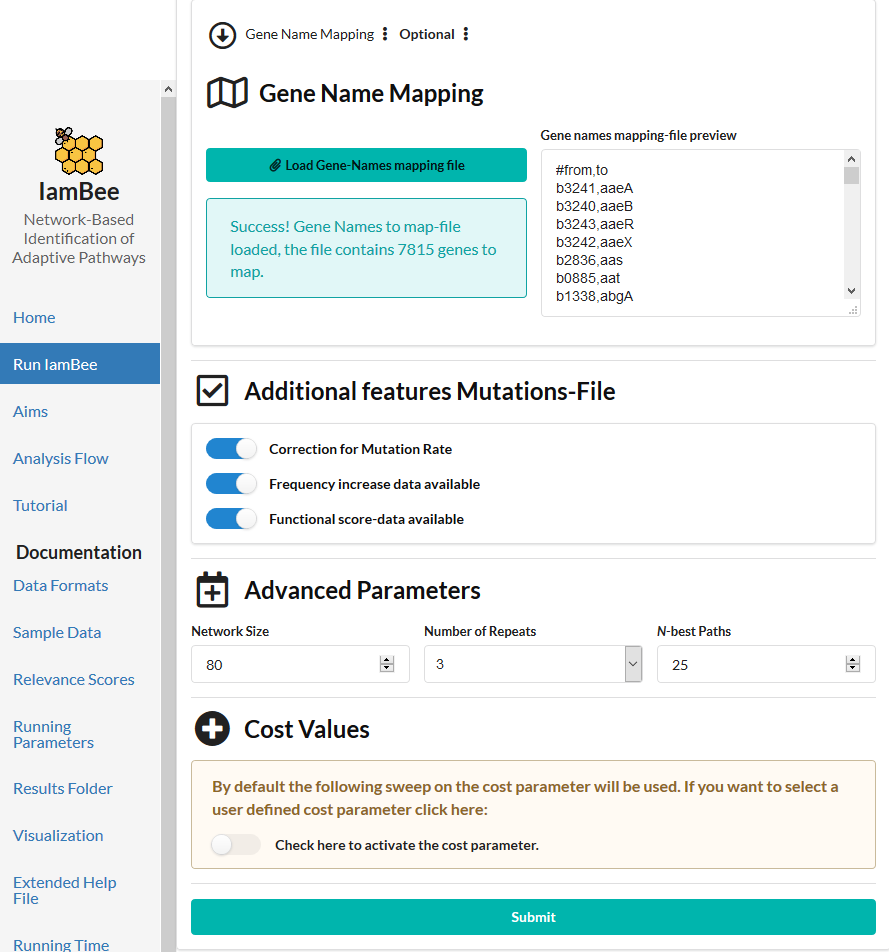
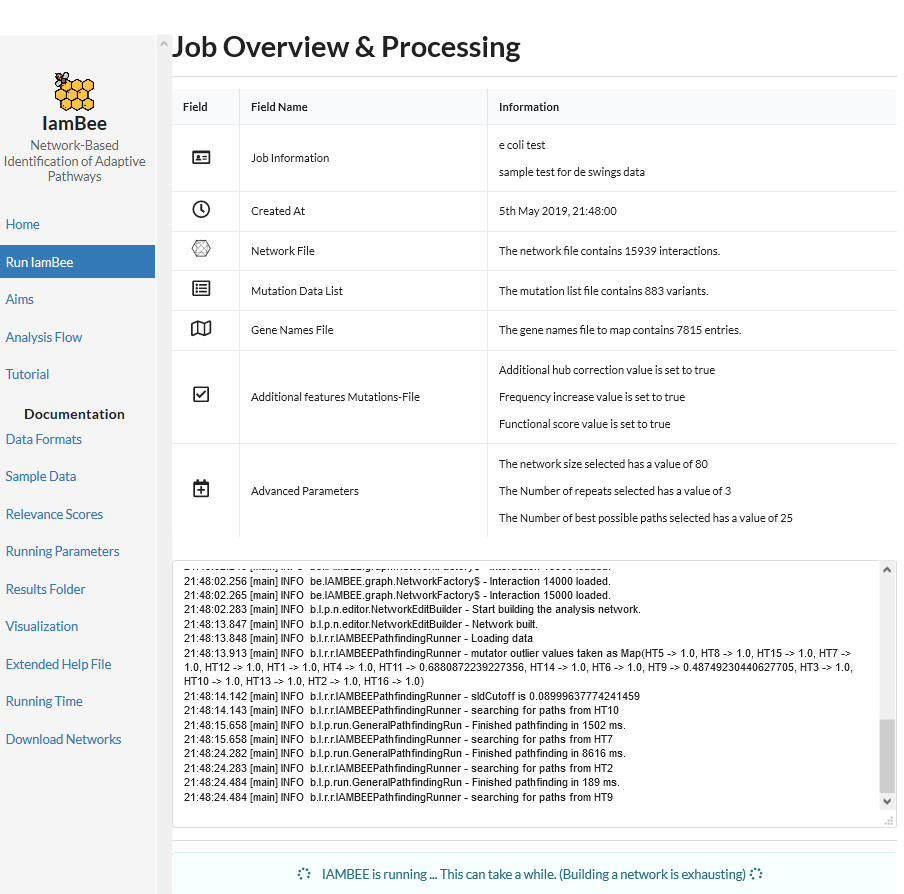
When the browser is open during the run, you can follow the progress. Possible errors in input files will also appear.
After the run is finished results can be:
- Downloaded
- Visualized in the browser
- Emailed
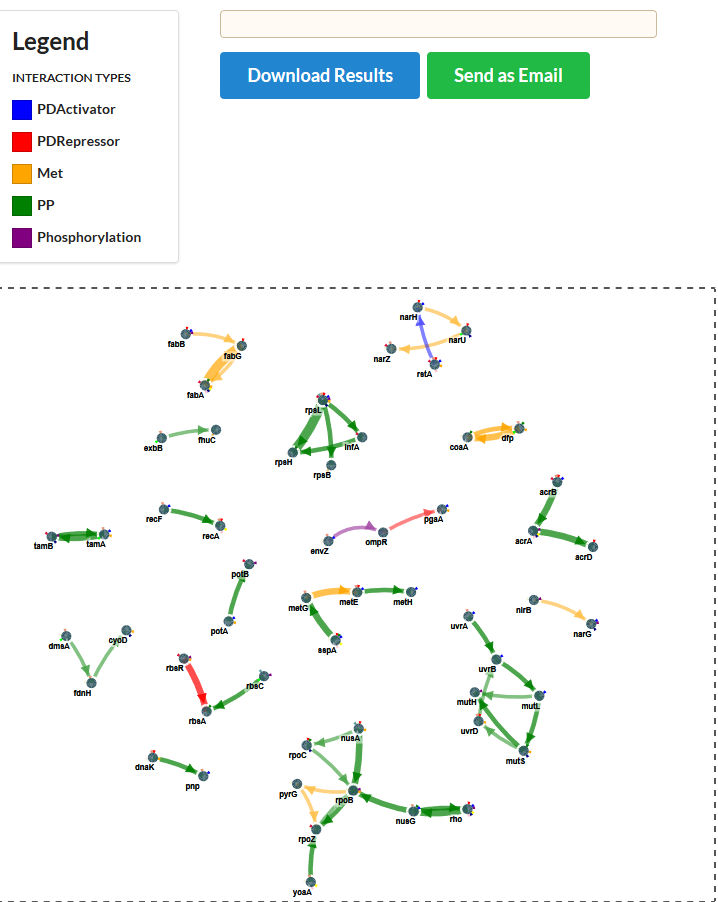
In the network plot, the width of the edges represents the largest edge cost at which the edge was detected. The higher the edge cost, the more stringent the search and the more pronounced the signal was in the data that gave rise to the edges. Along the same lines you can download from the results folder the ‘rankedMutations.txt’ (in the folder opt/resulting_networks). Here all prioritized nodes are shown together with a rank. The higher the rank the more stringent the edge cost was at which this node was retrieved as member of the resulting sub-network (see list below).
How to interpret the results?
Start from an edge with large edge size or a node that is prioritized with a high rank. In the results above, a nice example of a prioritized path is tamB–tamA. TamB is an inner membrane protein that forms a complex (the translocation and assembly module or TAM) with the outer membrane protein, TamA. Almost all populations carry a mutation in the TamA-B system, being either through mutations in TamA or TamB.
TamA and B tend to be mutated in a mutually exclusive way which is to be expected if they together form the same system (colored triangles around the gene indicate the populations in which the gene was mutated): a mutation in TamA or TamB is sufficient to disrupt the entire system. Because of their connectivity in the network the TamA-B system is detected as a recurrently mutated sub-network. The same is observed for the other systems like e.g. the FabB, FabG and FabA system or for the mutS, mutL, mutH system.
Effect of the correction for mutator strains
Now we repeat the same run, but without using correction for mutator strains (still using the information on the functional impact and frequency increase).
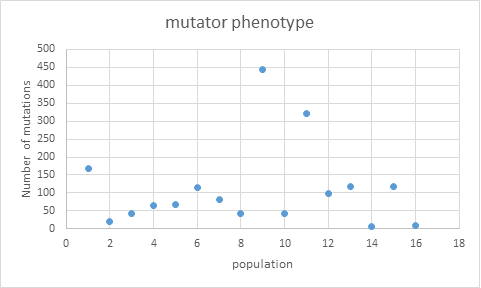
The table above shows how some populations clearly exhibit a mutator phenotype

Some of the populations show clearly more mutations than others (HT1, HT9, HT11). Using the formula described in Swings et al and on the help-file of the website the impact on the search of mutations originating from the mutator populations will be relatively down weighted. The net effect of the correction is that mutated genes originating from a highly mutated population will receive a relatively lower relevance score and hence will less affect the outcome of the optimization.
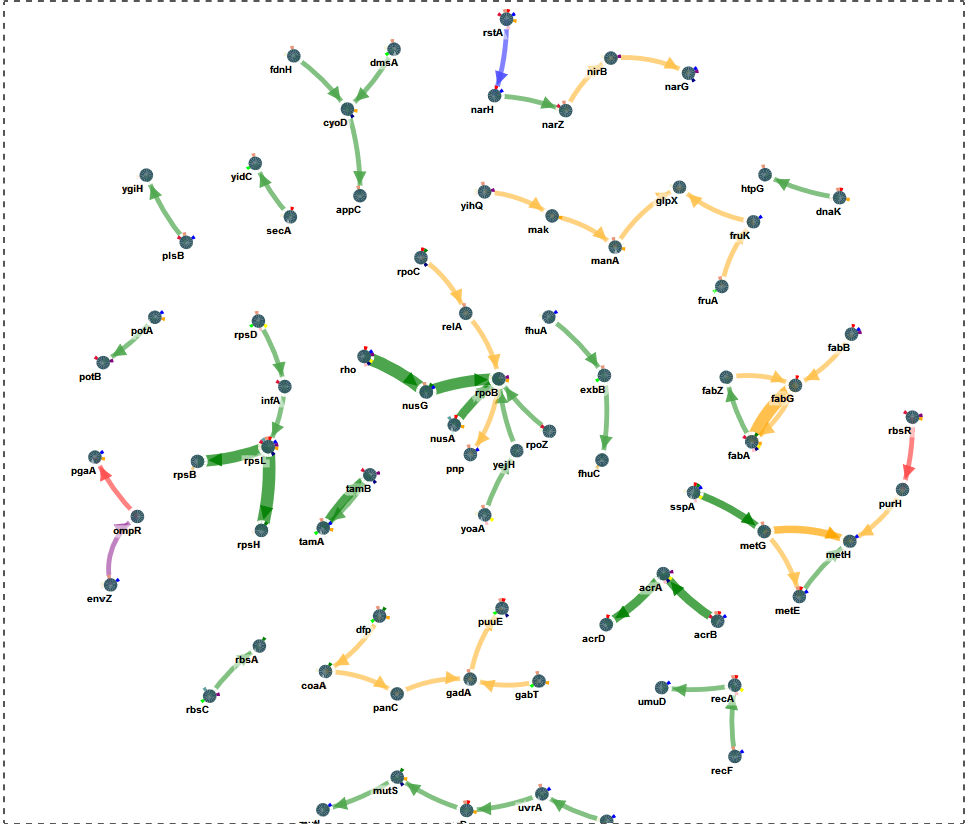
The impact of the down weighting is illustrated by comparing the list of prioritized genes obtained from the run without correction for mutator strains with the genes obtained from the run in which the correction was applied. These lists can be obtained from the downloaded results folder.
The gene list obtained without the correction is longer and contains several additional genes not present in the list in which the correction was applied. These additional genes were mainly mutated in populations with an elevated mutation rate (HT1, HT9, HT11) and most likely constitute spurious genes (genes carrying passenger mutations that were linked spuriously through the network to true adaptive genes). Correction for elevated mutation rate avoids prioritizing these genes.
| Gene ID | Gene Name | Condition/Population | Rank with Correction | Rank without Correction |
| b0954 | fabA | HT7, HT10, HT13, HT14, HT15, HT16 | 1 | 1 |
| b1093 | fabG | HT1 | 1 | 1 |
| b3306 | rpsH | HT5, HT10, HT10 | 1 | 1 |
| b3342 | rpsL | HT1, HT5, HT6, HT7, HT8, HT8, HT9, HT11, HT12, HT13, HT15 | 1 | 1 |
| b3783 | rho | HT1, HT11, HT12, HT14, HT15, HT16 | 2 | 1 |
| b3982 | nusG | HT9, HT10, HT11 | 2 | 1 |
| b0463 | acrA | HT12, HT14, HT15, HT16 | 3 | 3 |
| b2470 | acrD | HT1 | 3 | 3 |
| b3169 | nusA | HT1, HT2, HT8, HT13 | 3 | 4 |
| b3749 | rbsA | HT10 | 3 | 5 |
| b3753 | rbsR | HT7, HT12, HT13 | 3 | 6 |
| b3987 | rpoB | HT6, HT6, HT12, HT13 | 3 | 2 |
| b4220 | tamA | HT4, HT9, HT11, HT13 | 3 | 4 |
| b4221 | tamB | HT7, HT12, HT15 | 3 | 4 |
| b0169 | rpsB | HT3 | 4 | 2 |
| b0462 | acrB | HT1, HT7, HT9, HT9, HT9, HT11 | 4 | 3 |
| b2114 | metG | HT9, HT9 | 4 | 3 |
| b3229 | sspA | HT1, HT6, HT10, HT10, HT10, HT11, HT14, HT16 | 4 | 3 |
| b3829 | metE | HT1, HT9, HT11 | 4 | 4 |
| b0779 | uvrB | HT6, HT11 | 5 | 5 |
| b1125 | potB | HT7, HT12 | 5 | 5 |
| b1126 | potA | HT11, HT13 | 5 | 5 |
| b1808 | yoaA | HT6, HT9, HT9, HT14, HT16 | 5 | 4 |
| b2733 | mutS | HT10, HT13, HT15, HT15 | 5 | 5 |
| b2831 | mutH | HT12 | 5 | 5 |
| b3649 | rpoZ | HT6, HT7 | 5 | 4 |
| b3750 | rbsC | HT4, HT8, HT12 | 5 | 5 |
| b4019 | metH | HT11, HT11 | 5 | 3 |
| b4058 | uvrA | HT9, HT11 | 5 | 6 |
| b4170 | mutL | HT11 | 5 | 5 |
| b0014 | dnaK | HT1, HT1, HT5, HT9, HT13 | 6 | 6 |
| b0151 | fhuC | HT3 | 6 | 6 |
| b0429 | cyoD | HT13, HT15 | 6 | 6 |
| b0894 | dmsA | HT4, HT6, HT9 | 6 | 6 |
| b1024 | pgaA | HT11, HT13 | 6 | 6 |
| b1224 | narG | HT11, HT12, HT15 | 6 | 5 |
| b1225 | narH | HT1, HT11 | 6 | 6 |
| b1302 | puuE | HT1, HT4, HT9, HT15 | 6 | 6 |
| b1468 | narZ | HT6, HT7, HT9 | 6 | 6 |
| b1475 | fdnH | HT6, HT6, HT9 | 6 | 6 |
| b1608 | rstA | HT1, HT7, HT9, HT11, HT13, HT16, HT16 | 6 | 6 |
| b2167 | fruA | HT4, HT9 | 6 | 6 |
| b2323 | fabB | HT1, HT11, HT12 | 6 | 6 |
| b2662 | gabT | HT4, HT9, HT13 | 6 | 6 |
| b2699 | recA | HT1, HT9, HT14, HT16 | 6 | 6 |
| b2780 | pyrG | HT6 | 6 | |
| b2935 | tktA | HT13, HT15 | 6 | |
| b3006 | exbB | HT4, HT9 | 6 | 6 |
| b3164 | pnp | HT9, HT11 | 6 | 5 |
| b3296 | rpsD | HT4, HT9, HT14, HT16 | 6 | 5 |
| b3365 | nirB | HT6, HT12 | 6 | 5 |
| b3404 | envZ | HT5, HT6, HT9, HT11 | 6 | 6 |
| b3564 | xylB | HT9, HT9, HT15, HT15, HT15 | 6 | |
| b3639 | dfp | HT4, HT9, HT10, HT13 | 6 | 4 |
| b3700 | recF | HT9, HT9, HT11 | 6 | 6 |
| b3770 | ilvE | HT6 | 6 | |
| b3974 | coaA | HT6, HT10 | 6 | 4 |
| b3988 | rpoC | HT1, HT1, HT10, HT15, HT15 | 6 | 6 |
| b0098 | secA | HT1, HT6 | 6 | |
| b0143 | pcnB | HT3, HT3, HT12 | 6 | |
| b0150 | fhuA | HT6, HT11 | 6 | |
| b0394 | mak | HT13 | 6 | |
| b0884 | infA | HT7 | 6 | |
| b0978 | appC | HT9 | 6 | |
| b1084 | rne | HT4, HT9, HT12 | 6 | |
| b1465 | narV | HT6 | 6 | |
| b2763 | cysI | HT8, HT8 | 6 | |
| b3059 | ygiH | HT5 | 6 | |
| b3517 | gadA | HT9, HT9 | 6 | |
| b3705 | yidC | HT4, HT9, HT9 | 6 | |
| b3813 | uvrD | HT1, HT9, HT13 | 6 | |
| b3878 | yihQ | HT5, HT6, HT9, HT12 | 6 | |
| b3925 | glpX | HT6 | 6 | |
| b4041 | plsB | HT7, HT7, HT9, HT11, HT11 | 6 |
We now repeat the run omitting the information from the frequency increase during the selective sweep.

Results show that the nodes and paths that were detected with a high confidence (at high cost) are the same as in the other runs. So the most pronounced signals are still always recovered irrespective of the parameter setting. This indicates that the algorithm’s performance is robust against potential noise in the data. However the current network contains more mutated genes that could be connected to the network. Most of these genes are detected at a low cost parameter only, indicating their signal is not extremely pronounced (meaning that they are mutated in a few populations only and not well connected to genes mutated in other populations). These are genes that are mutated in the populations but of which the frequency did not necessarily increase during the sweep. So despite being present in the populations and being connected in the network, they are not necessarily related to the adaptive phenotype.
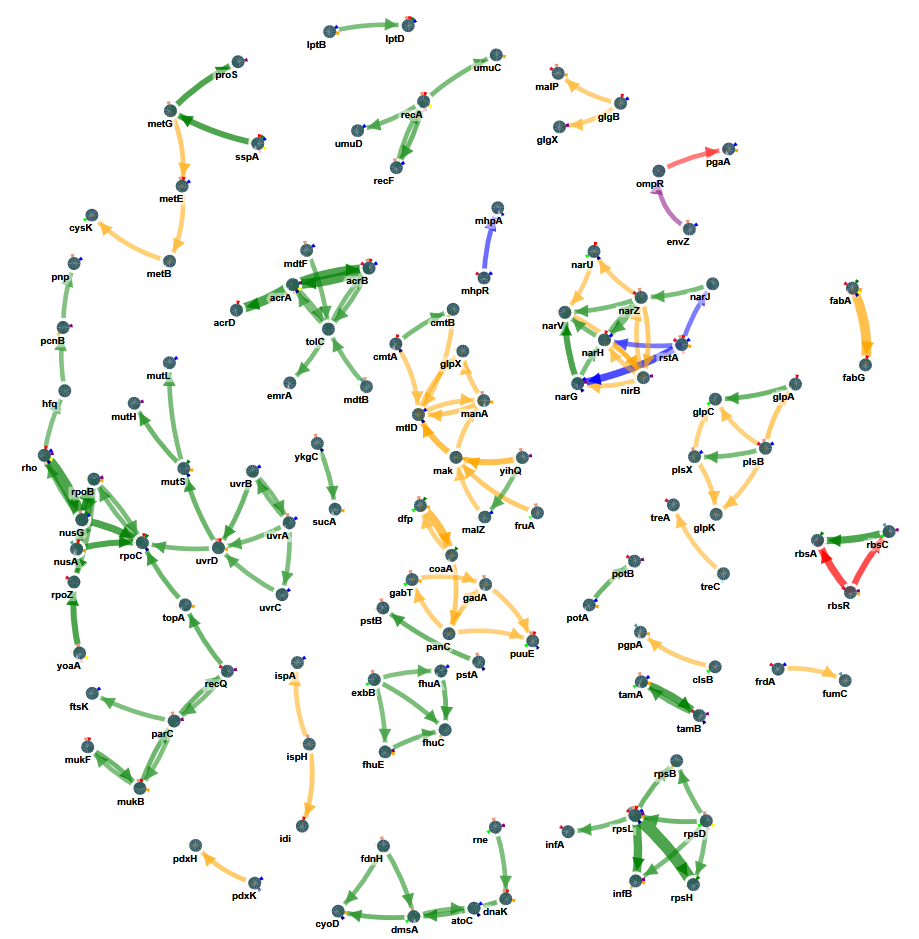
We now repeat the run omitting the information from the functional impact of the mutations.
Doing this tremendously increase the search space as our input file contains for some populations a high number of mutations. Without weighting these mutations the algorithm has many different options to explore. The run took > 4 h so we closed the browser and waited for the email. From the results it appears that again the most prominent signals are present in the results (tamA-B, Fab, uvr-mut, acr are ranked highest) but not so much prioritized as previously. Several additional small connected components can be detected that might consist of passenger mutations that hitchhiked during the sweep but of which the likely functional impact is low (more spurious connections and prioritizations, ranks of most prioritizations are low).
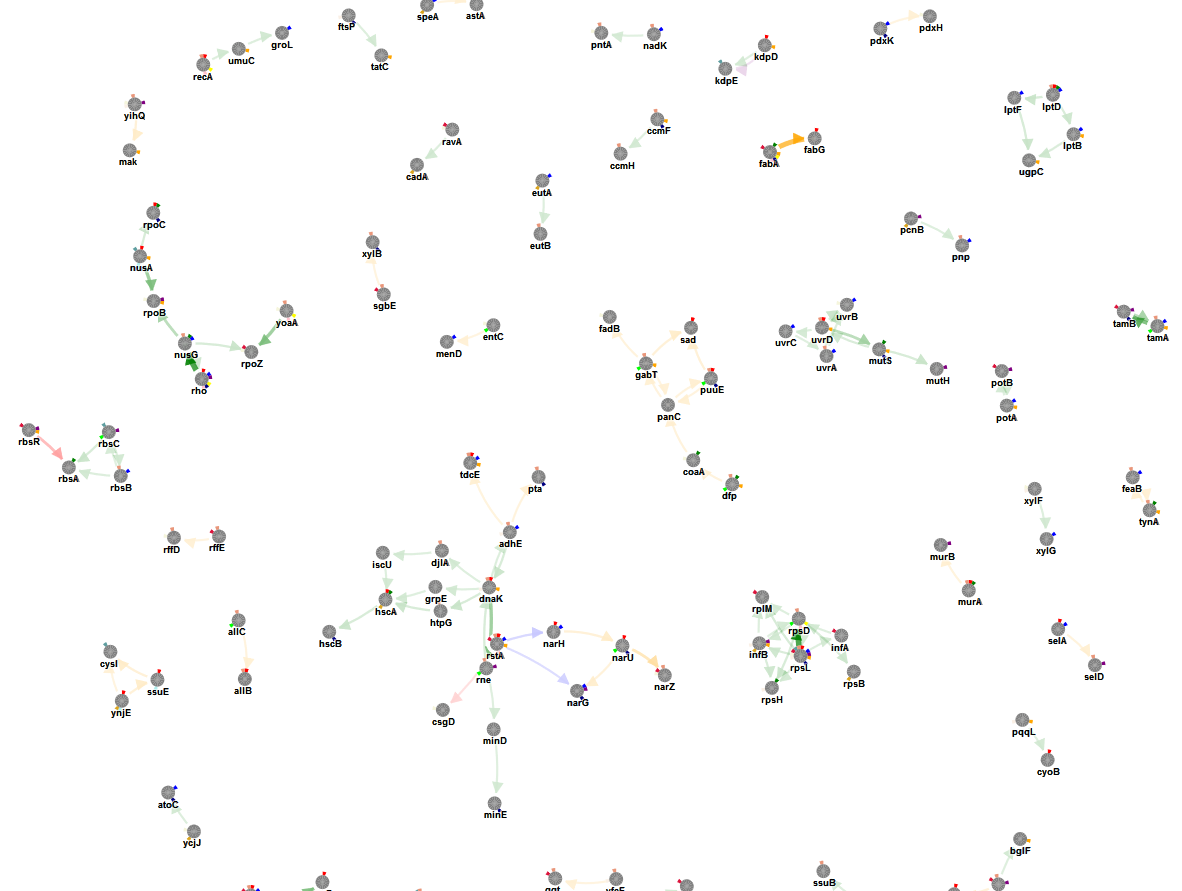
| Gene ID | Gene Name | Rank | Population/Condition |
| b3296 | rpsD | 1 | HT4, HT9, HT14, HT16 |
| b3342 | rpsL | 1 | HT1, HT5, HT6, HT7, HT8, HT8, HT9, HT11, HT12, HT13, HT15 |
| b3783 | rho | 1 | HT1, HT11, HT12, HT14, HT15, HT16 |
| b3982 | nusG | 1 | HT9, HT10, HT11 |
| b0954 | fabA | 2 | HT7, HT10, HT13, HT14, HT15, HT16 |
| b1093 | fabG | 2 | HT1 |
| b4220 | tamA | 3 | HT4, HT9, HT11, HT13 |
| b4221 | tamB | 3 | HT7, HT12, HT15 |
| b0014 | dnaK | 4 | HT1, HT1, HT5, HT9, HT13 |
| b0462 | acrB | 4 | HT1, HT7, HT9, HT9, HT9, HT11 |
| b0463 | acrA | 4 | HT12, HT14, HT15, HT16 |
| b1084 | rne | 4 | HT4, HT9, HT12 |
| b1808 | yoaA | 4 | HT6, HT9, HT9, HT14, HT16 |
| b2470 | acrD | 4 | HT1 |
| b3169 | nusA | 4 | HT1, HT2, HT8, HT13 |
| b3649 | rpoZ | 4 | HT6, HT7 |
| b3987 | rpoB | 4 | HT6, HT6, HT12, HT13 |
| b1468 | narZ | 5 | HT6, HT7, HT9 |
| b1469 | narU | 5 | HT1, HT4, HT15, HT15 |
| b2733 | mutS | 5 | HT10, HT13, HT15, HT15 |
| b3749 | rbsA | 5 | HT10 |
| b3753 | rbsR | 5 | HT7, HT12, HT13 |
| b3813 | uvrD | 5 | HT1, HT9, HT13 |
| b0054 | lptD | 6 | HT1, HT9, HT10, HT11 |
| b0394 | mak | 6 | HT13 |
| b0473 | htpG | 6 | HT9 |
| b0677 | nagA | 6 | HT1 |
| b0679 | nagE | 6 | HT7, HT9, HT12 |
| b0779 | uvrB | 6 | HT6, HT11 |
| b0937 | ssuE | 6 | HT1, HT2 |
| b1225 | narH | 6 | HT1, HT11 |
| b1241 | adhE | 6 | HT5, HT9, HT11 |
| b1302 | puuE | 6 | HT1, HT4, HT9, HT15 |
| b1525 | sad | 6 | HT1 |
| b1608 | rstA | 6 | HT1, HT7, HT9, HT11, HT13, HT16, HT16 |
| b1757 | ynjE | 6 | HT1, HT2, HT3 |
| b2114 | metG | 6 | HT9, HT9 |
| b2526 | hscA | 6 | HT1, HT3, HT10 |
| b2527 | hscB | 6 | HT15 |
| b2662 | gabT | 6 | HT4, HT9, HT13 |
| b2763 | cysI | 6 | HT8, HT8 |
| b2831 | mutH | 6 | HT12 |
| b2989 | yghU | 6 | HT1, HT11 |
| b3229 | sspA | 6 | HT1, HT6, HT10, HT10, HT10, HT11, HT14, HT16 |
| b3231 | rplM | 6 | HT7 |
| b3306 | rpsH | 6 | HT5, HT10, HT10 |
| b3450 | ugpC | 6 | HT13 |
| b3750 | rbsC | 6 | HT4, HT8, HT12 |
| b3878 | yihQ | 6 | HT5, HT6, HT9, HT12 |
| b3988 | rpoC | 6 | HT1, HT1, HT10, HT15, HT15 |
| b4261 | lptF | 6 | HT11 |
| b0169 | rpsB | 7 | HT3 |
| b1224 | narG | 7 | HT11, HT12, HT15 |
| b3168 | infB | 7 | HT3, HT5, HT12, HT13, HT13, HT13, HT13, HT13, HT13, HT13, HT13, HT13, HT13 |
| b3201 | lptB | 7 | HT11, HT13 |
| b1184 | umuC | 8 | HT13, HT13 |
| b2699 | recA | 8 | HT1, HT9, HT14, HT16 |
| b3639 | dfp | 8 | HT4, HT9, HT10, HT13 |
| b3751 | rbsB | 8 | HT9, HT11 |
| b3974 | coaA | 8 | HT6, HT10 |
| b4058 | uvrA | 8 | HT9, HT11 |
| b4143 | groL | 8 | HT11 |
| b1296 | ycjJ | 9 | HT3, HT6 |
| b1764 | selD | 9 | HT9, HT12 |
| b2220 | atoC | 9 | HT11, HT15 |
| b2297 | pta | 9 | HT9, HT15 |
| b2890 | lysS | 9 | HT7 |
| b3591 | selA | 9 | HT1, HT11 |
| b3706 | mnmE | 9 | HT6, HT9 |
| b3741 | mnmG | 9 | HT8, HT8, HT9, HT9 |
| b3746 | ravA | 9 | HT6, HT7 |
| b3846 | fadB | 9 | HT6 |
| b4131 | cadA | 9 | HT3 |
| b1385 | feaB | 10 | HT9, HT11 |
| b1386 | tynA | 10 | HT9, HT9, HT10, HT13 |
| b2301 | yfcF | 10 | HT5, HT9 |
| b3114 | tdcE | 10 | HT1, HT9, HT11, HT13 |
| b3189 | murA | 10 | HT1, HT9, HT10 |
| b3722 | bglF | 10 | HT13 |
| b3972 | murB | 10 | HT12 |
| b0055 | djlA | 11 | HT9 |
| b0143 | pcnB | 11 | HT3, HT3, HT12 |
| b0418 | pgpA | 11 | HT8, HT13 |
| b0431 | cyoB | 11 | HT1 |
| b0512 | allB | 11 | HT1, HT9 |
| b0516 | allC | 11 | HT4, HT9, HT9 |
| b0933 | ssuB | 11 | HT9 |
| b0936 | ssuA | 11 | HT7, HT13 |
| b1278 | pgpB | 11 | HT4, HT9, HT9 |
| b1494 | pqqL | 11 | HT5, HT5, HT13 |
| b1912 | pgsA | 11 | HT8, HT9, HT11 |
| b2441 | eutB | 11 | HT9 |
| b2451 | eutA | 11 | HT3, HT11 |
| b3017 | ftsP | 11 | HT5, HT15 |
| b3164 | pnp | 11 | HT9, HT11 |
| b3566 | xylF | 11 | HT5, HT6 |
| b3567 | xylG | 11 | HT11 |
| b3839 | tatC | 11 | HT13 |
| b0884 | infA | 12 | HT7 |
| b0694 | kdpE | 13 | HT8 |
| b0695 | kdpD | 13 | HT1, HT13 |
| b0789 | clsB | 13 | HT4, HT5 |
| b1125 | potB | 13 | HT7, HT12 |
| b1126 | potA | 13 | HT11, HT13 |
| b1174 | minE | 13 | HT15 |
| b1913 | uvrC | 13 | HT11 |
| b2194 | ccmH | 13 | HT9 |
| b2196 | ccmF | 13 | HT9, HT13, HT15 |
| b3725 | pstB | 13 | HT5, HT9 |
| b3727 | pstC | 13 | HT4, HT9 |
| b0593 | entC | 14 | HT4, HT6 |
| b1040 | csgD | 14 | HT6 |
| b1244 | oppB | 14 | HT11 |
| b1329 | mppA | 14 | HT5, HT9 |
| b1603 | pntA | 14 | HT6, HT9 |
| b1638 | pdxH | 14 | HT6 |
| b1747 | astA | 14 | HT1 |
| b2264 | menD | 14 | HT11 |
| b2418 | pdxK | 14 | HT11, HT15 |
| b2615 | nadK | 14 | HT9, HT11 |
| b2938 | speA | 14 | HT3, HT11 |
| b3447 | ggt | 14 | HT7, HT9 |
| b3564 | xylB | 14 | HT9, HT9, HT15, HT15, HT15 |
| b3583 | sgbE | 14 | HT7, HT9 |
| b3786 | rffE | 14 | HT7, HT9 |
| b3787 | rffD | 14 | HT6, HT9 |
Yeast Case Study
The data were obtained from the study of Jerison et al. 2017 contained S. cerevisiae populations that were evolved for 500 generations in optimal temperature. 273 different founder strains were used (different genomic context). The founders selected for this sequencing were chosen to ensure approximately equal representation of each parental KRE33 allele, but were otherwise random. For each founder 4 parallel populations were obtained that were evolved under ordinary temperature (OT). Per population the variants with an allele frequency >60% were selected, 68% were at > 90% frequency. Most mutations in the given list were nonsynonymous. The list of de novo mutations in each of the populations evolved under OT conditions was obtained from the authors of the paper and can be downloaded here.
The figure below gives an overview of the different genes containing de novo mutations as were detected in the original paper.
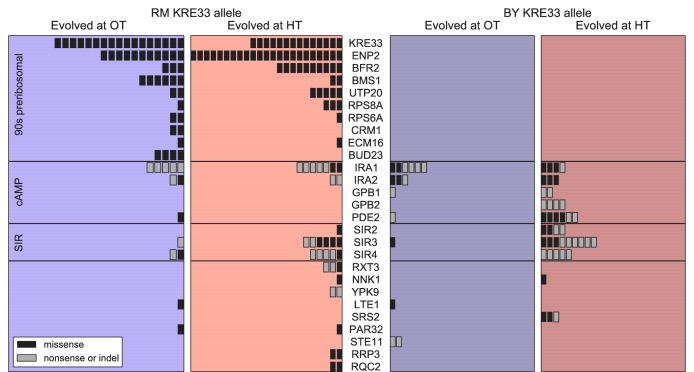
The list below recapitulates the genes described in the paper, (*) indicates that the genes were detected with IAMBEE-run1; (not in strict network) indicates the genes were not in the network used in run and hence could not be retrieved.
- YNL132W,KRE33 *
- YGR145W,ENP2 (*, not in strict network)
- YDR299W,BFR2 (*, not in strict network)
- YPL217C,BMS1 (*)
- YBL004W,UTP20 (*)
- YBL072C,RPS8A (*)
- YPL090C,RPS6A (*)
- YGR218W, CRM1
- YMR128W,ECM16 (*)
- YBR140C,IRA1 (*, not in strict network)
- YOL081W,IRA2 (*, not in strict network)
- YOR360C,PDE2 (*, not in strict network)
- YDL042C,SIR2
- YLR442C,SIR3 (*, not in strict network)
- YDR227W,SIR4 (*, not in strict network)
Run1: Strict network (edge probability cutoff of 0.95)
In this setting we run IAMBEE with a S. cerevisiae STRING derived network (stringency of the edges larger >0.95). The network contains about 16000 edges. We used as input all variants excluding the synonymous variants and the variants that were in the input file not mapped on genes (intergenic etc). A default parameter sweep was performed (note that in the default setting the parameters of the cost used during the sweep are determined automatically and are dataset specific. The parameter values used are available in the results folder. Only compensation for the mutator phenotype was used as the functional information and the increase in frequency during the sweep were not available (make sure these sliders are switched off).

This run took about 30 minutes.
The result can be visualized in the browser. However to assess the relevance of the results, download the results folder and unzip the folder. Go to the folder "\opt\resulting_networks\d3js_visualization"
You can open the file ‘highestScoringSubnetwork.html’ and visualize the network in the browser. The edge width is here replaced by the opacity of the edges. Edges which are more dark in color represent the more significant signals in the data. A print screen of this network is given below.
From the folder \opt\resulting_networks\ open the file rankedMutations.txt. You will see the set of genes that were prioritized together with their rank (based on the sweep on the cost parameter). A lower rank means that the gene was already prioritized at a higher cost value and hence represents a more significant signal in the data.
To interpret the visualization results it is important to focus on the genes indicated in this file. These are the genes that carry the actual mutations. In the network visualization many more genes are indicated some of which are ‘connector genes’. Genes that are used to find paths that connected the mutated genes. For each mutated gene the visualization provides in the circle around the gene a colored section which indicates the population in which the gene was mutated (see below as indicated in the figure). Genes with a colored section are the ones that are mutated and can be retrieved in the text file.
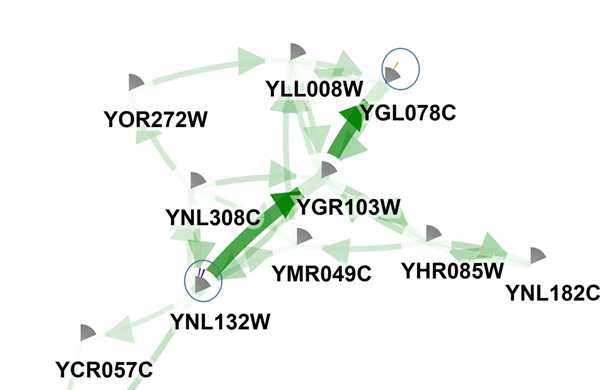
Example of the text file with prioritized genes for run1.
- YPL217C 1
- YGL078C 1
- (*) YNL132W 1
- YPL090C 2
- YEL037C 3
- YER025W 3
- YBL072C 3
- YER162C 3
- YNL308C 3
- YMR128W 3
- YKR095W 3
- YMR047C 3
- YBL079W 3
- YDR390C 3
- YNL182C 3
- YER102W 3
- YJL039C 3
- YGL150C 4
- YER127W 4
- YDL132W 4
- YJL081C 4
- YDR096W 5
- YGR184C 5
- YPR019W 5
- YNL262W 5
- YDR238C 6
- YOL138C 6
- YOR022C 6
- YMR218C 6
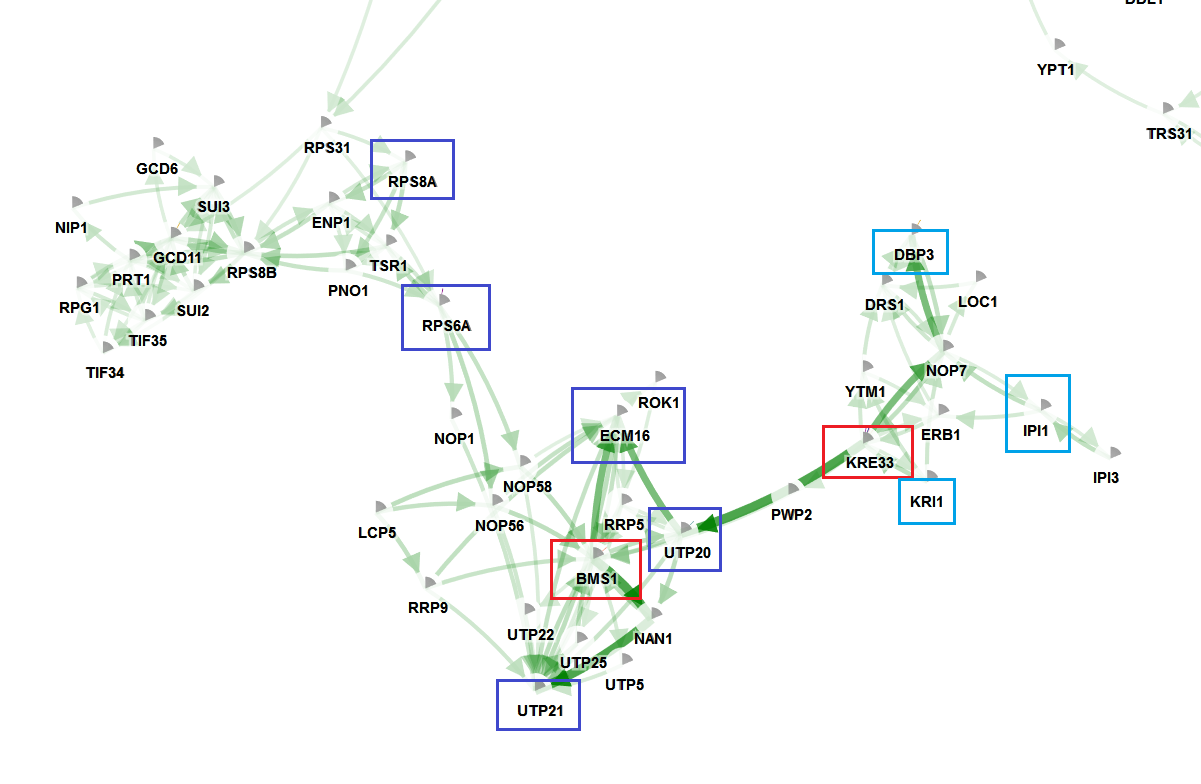
To focus on genes or sub-network, start with the highest ranked genes from the list is possibility. Usually these genes are also the most frequently mutated (indicating that the optimization does its job correctly). For instance, YNL132W (KRE33). The figure shows the location of KRE33 and its neighboring mutated genes (indicated figure with red and blue box respectively). These are the genes prioritized because they are part of a recurrently mutated sub-network (despite the fact that most of them are only mutated once or twice over all populations. The network in its entirety is frequently mutated.
- YNL132W (KRE33 - frequently mutated, KRE33 was present in the background genome of certain founders of the population): Protein required for biogenesis of the small ribosomal subunit; heterozygous mutant shows haploinsufficiency in K1 killer toxin resistance; essential gene; NAT10, the human homolog, implicated in several types of cancer and premature aging
- YGL078C (DBP33 - mutated once): RNA-Dependent ATPase, member of DExD/H-box family; involved in cleavage of site A3 within the ITS1 spacer during rRNA processing; not essential for growth, but deletion causes severe slow-growth phenotype
- YNL308C (KRI1 - mutated once): Essential nucleolar protein required for 40S-ribosome biogenesis; associate with snR30; physically and functionally interacts with Krr1p-kri1
- YNL182C (IPI1 - mutated once): Component of the Rix1 complex and pre-replicative complexes (pre-RCs). It is required for processing of ITS2 sequences from 35S pre-rRNA, component of the pre-60S ribosomal particle with the dynein-related AAA-type ATPase Mdn1p; required for pre-RC formation and maintenance during DNA replication licensing; highly conserved protein which contains several WD40 motifs; IPI3 is an essential gene; other members include Rix1p, Ipi1p, and Ipi3p, IPI3
Another frequently mutated gene is YPL217C (BMS1). This gene together with its neighbor are also located on the network (red boxed). These genes together with its mutated neighbors from the prioritized list forms a second recurrently mutated subcluster.
- YPL217C (BMS1 - mutated frequently): GTPase required for ribosomal subunit synthesis and rRNA processing; required for synthesis of 40S ribosomal subunits and for processing the 35S pre-rRNA at sites A0, A1, and A2; interacts with Rcl1p, which stimulates its GTPase and U3 snoRNA binding activities; has similarity to Tsr1p
- YBL004W (UTP20 - mutated twice): Component of the small-subunit (SSU) processome; SSU processome is involved in the biogenesis of the 18S rRNA
- YLR409C (UTP21) (mutated once): Subunit of U3-containing 90S pre-ribosome and SSU processome complexes; involved in production of 18S rRNA and assembly of small ribosomal subunit; synthetic defect with STI1-Hsp90 cochaperone; human homolog linked to glaucoma; Small Subunit processome is also known as SSU processome.
- YPL090C (RPS6A - mutated twice): Protein component of the small (40S) ribosomal subunit; homologous to mammalian ribosomal protein S6, no bacterial homolog; phosphorylated on S233 by Ypk3p in a TORC1-dependent manner, and on S232 in a TORC1/2-dependent manner by Ypk1/2/3p; RPS6A has a paralog, RPS6B.
- YBL072C (RPS8A - mutated once): Protein component of the small (40S) ribosomal subunit; homologous to mammalian ribosomal protein S8, no bacterial homolog; RPS8A has a paralog, RPS8B, that arose from the whole genome duplication
- YMR128W (ECM16- mutated once): Essential DEAH-box ATP-dependent RNA helicase specific to U3 snoRNP; predominantly nucleolar in distribution; required for 18S rRNA synthesis.
The sub-networks indicated with the blue and red boxes are also the sub-networks that receive the highest edge width (in the online visualization) or lowest opacity in the html offline visualization.
Some of the infrequently mutated genes (those that received e.g. rank 6), that appear to have been mutated only once in the population and that are not located in a cluster of frequently mutated genes are likely passengers. At the least stringent cost, passengers can get connected spuriously.
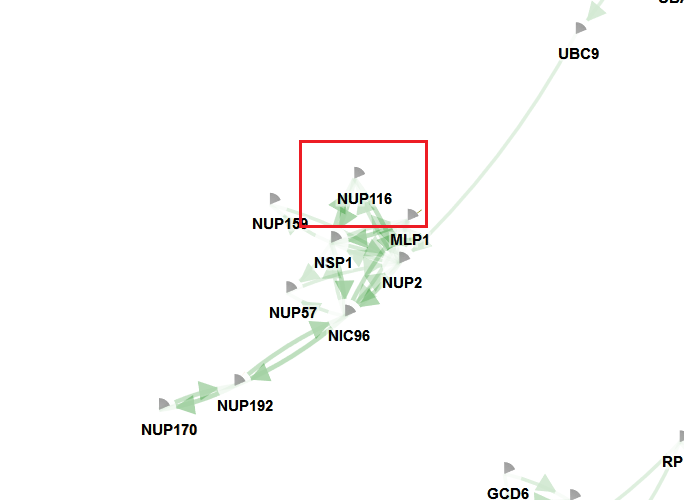
The example shows that IAMBEE finds as a recurrently mutated sub-network a set of genes that is involved in 90s preribosomal pathway which is in line with the results described in the original paper. Note that some of the genes described in the paper of Jerison et al could not be recovered in this run, mainly because they were not connected in the network. Therefore it is important to ensure that the ‘mutated genes’ are connected in the network, otherwise one might not be able to recover them.

