|
(back to : guidelines)
Demonstrate the value of MotifRankings metrics on real benchmark datasets.
==============================================================================
The following statements are discussed in the case study :
1) motifs with return ratio lower than 10% (and/or motif count lower than 10) correspond to bad predictions
2) interpretation of multiple significant motifs with similar scores
3) amongst multiple significant motifs, the motif with the highest LogLikelihood score is the best candidate to be a biologically true motif
4) the return ratio is an indicator for the accuracy with which a motif can be predicted
Conclusion
BENCHMARK SET UP
We created 43 E. coli datasets each containing 1 known motif (taken from RegulonDB, read more).
We ran MotifSampler(*) 100 times on each dataset and reported the convergence rate (Conv, **), that is the total number of solutions (motifs) reported by these 100 stochastically initiated motif detection runs.
In what follows, we demonstrate how to use the metrics in MotifRanking (motif count(N)|return ratio(RR) and motif score) to extract the most likely true motif from the multiple stochastically obtained motif predictions by MotifSampler.
DESCRIPTION OF RUNNING MOTIFRANKING
We ran MotifRanking on the list on multiple motifs (PWMs) reported by MotifSampler for a given dataset (each of the benchmark 43 datasets) with the following parameter settings:
Motifs that are redundant representations of a same motif are represented by the motif with the highest LogLikelihood(LL) score (parameter -m = 0),
have a similarity distance to the representative motif lower than 0.4 (default parameter -t) and have at least 50% overlap with the representative motif
(we set parameter -x equal to half of the width of the known motif (as described in RegulonDB)
and parameter -s is disabled by setting it to a very high value).
The output of MotifRanking displays maximally 5 (default paramameter -r) representative motifs sorted according to their LogLikelihood(LL) score.
PRIORITIZE THE MOST LIKELY TRUE MOTIFS
From the list of representative motifs reported by MotifRanking, we select the one with the highest LL score that has a count N higher than 10,
further called motif-1. If the list contains another motif with count >10 (but with lower LL score), we select this prediction as motif-2.
If two motifs are retained, we explicitly re-evaluate if they describe a truly different motif by running MotifComparison(*).
If no motif was obtained with a count >10, we retain the motif with the highest count as motif-1.
DEFINITION OF PERFORMANCE INDICATORS
For motif-1 and (if present) motif-2, we report the number of times (count N) this motif was detected by MotifSampler and (if N>10)
we verify if there is enough statistical evidence for this motif to be a true one by evaluating the return ratio (RR) of the motif.
The return ratio (RR, **) is computed as the number of solutions that detected this motif (count N) divided by the total number of reported
solutions by MotifSampler (Conv). At the same time, we report the LogLikelihood (LL) and consensus score CS of each retained solution.
Finally, we verify how accurately the full set of known instances is covered by the retained solution(s). The positive predictive value (PPV, **)
is a measure for how many of the detected instances are true (for this we assume that instances unknown in RegulonDB are untrue) and
the sensitivity (sens, **) measures how many of the known instances (as described in RegulonDB) are correctly identified in the reported set of motif instances. The best performance is obtained when PPV equals the highest value (1.00, there are no untrue instances reported) and sensitivity equals the highest value (1.00, all true instances are detected).
For each of the 43 datasets, MotifSampler was repeated 10 times to average out particularly good or bad results that may be obtained
by chance in the stochastic framework of MotifSampler. So here we run the whole procedure (running MotifRanking and computing performance indicators)
on each of the 10 MotifSampler outputs on a given dataset.
We report the average values of the performance indicators (N, RR, LL, CS, PPV and sens) over these 10 repetitions in a given dataset in
Table 3. All performance indicator results described in the following discussion are copied or derived
(e.g. compute average value of the performance indicator over a subset of benchmark datasets) from Table 3.
1) MOTIFS WITH A RETURN RATIO LOWER THAN 10% (AND/OR MOTIF COUNT <10) CORRESPOND TO BAD PREDICTIONS
Spurious solutions consisting of randomly obtained instances do not reflect an overrepresented motif signal in a given sequence set
and are not expected to frequently reoccur in multiple runs of MotifSampler.
The return ratio (RR) can therefore be used to filter spurious motifs from true ones. From our experience, a minimal return ratio (RR) of 10% (on 100 reported solutions by MotifSampler) has shown to offer a good balance between
filtering out spurious solutions while still retaining biologically true motifs that are difficult to detect.
If the number of solutions reported by MotifSampler is lower than 100 (because runs were aborted and no solution could be obtained
or because less runs were initiated), the threshold on the RR should be set higher to keep a similar confidence in the predictions.
For this reason we choose to add as an additional selection criterium the removal of motifs with an absolute count lower than 10
(despite their RR being >10%) as these usually are unreliable predictions.
For 15 out of 43 datasets (datasets list-1), MotifRanking only reports solutions with a return ratio lower than 10%,
so no significant solution is reported in those cases. The decision not to retain a solution seemed to be correct
as the most frequently detected solution (motif-1) in each of those 15 datasets hardly correspond to the known motif (sensitivity order 0.1)
and consisted mainly of unknown instances (PPV order 0.1). In those datasets, the low overrepresentation of the known motif
(as shown by its weak conservation: consensus score lower than 0.8) or (for DgsA:) low number of instances in a small dataset complicated their
de novo detection.
2) INTERPRETATION OF MULTIPLE SIGNIFICANT MOTIFS WITH SIMILAR SCORES
(we discuss here all datasets where MotifRanking reported two significant motifs i.e. RR>10% for motif-1 and motif-2, data in below Table 3a are extracted from archive-Table3)
The similarity threshold (MotifRankings parameter -t) to decide whether or not PWMs describe the same overrepresented signal,
is empirically set to a rather stringent value in MotifRanking. Consequently, MotifRanking may also report top-ranked motifs that are in fact different
representations of the same motif. In general, reporting partially redundant solutions occurs when MotifSampler finds a (more or less same) subset of
(well conserved) true motif instances well, but also picks up a set of (randomly sampled) untrue instances that obscure the motif PWM
in a different way in the solutions of multiple runs of MotifSampler. This is observed for datasets DnaA, FlhDC and RcsAB (Table 3a, set-1)
where a small subset of detected known instances (low sensitivity) is overshadowed by many unknown instances (low PPV) in both motif-1 and motif-2.
For the OxyR dataset, the known motif is weakly conserved (low PWM-CS) explaining why motif-1 and motif-2 (both representing the same true motif)
are despite their relatively high PPV and sens so much affected by a few different unknown instances. For all these mentioned datasets, the
scores (LL score and consensus score) of the two best ranked motifs motif-1 and motif-2 are of the same order,
which is in general (but not necessarily) a first indication that the similarity of different top-ranked motifs should be re-evaluated.
Treating two redundant motifs as different ones might result in underestimating the RR and
therefore the detection of a potentionally true motif might remain unseen (such as was the case for OxyR which had a low RR while sens and PPV are high).
However, we noticed that at MotifRankings default similarity threshold, the redundancy is in general an indication that the true motif
is not well detectable by MotifSampler and even the best motif (highest LL and/or RR) out of the redundant solutions is
most likely not a very good candidate for further biological assessment (as observed for datasets DnaA, FlhDC, RcsAB where sens and PPV are
low to moderate in motif-1).
For all other datasets (Table 3a (set-2)), the two most significant motifs -sometimes with similar scores- truly represent different motif signals.
Although we know only of one biologically true motif in each benchmark dataset (which is well described by motif-1[high PPV, moderate to high sens]
in datasets EvgA, FadR, GalS, GalR and NtrC and partially by motif-2[moderate sens and PPV] in datasets MetR and RcsAB),
we cannot exclude that motifs different to the known motif may also represent a possibly true motif
[although a low consensus score and borderline significance do indicate that these motifs most likely not describe a true motif very well]).
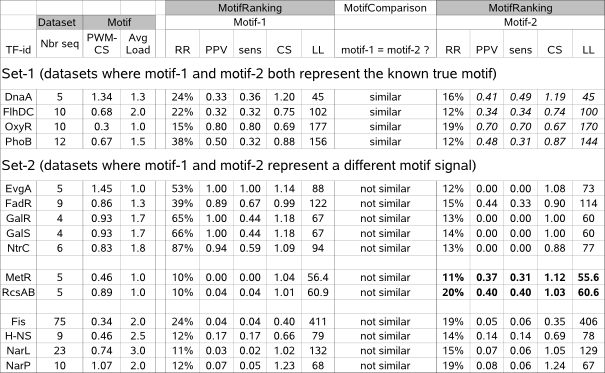
Table 3a : It is advised to re-evaluate the (dis)similarity of multiple motifs (motif-1 and motif-2) reported by MotifRanking for a given sequence set.
Set-1 : motif-1 and motif-2 have similar scores and report the same motif after all. Set-2 : motif-1 and motif-2 represent a different motif.
Legend : Dataset and motif properties : Nbr seq = number of sequences, PWM-CS = known motif consensus score, Avg Load = ~average number of known instances per sequence. Properties of the detected motif : N = number of times detected by MotifSampler, PPV = fraction of instances that is known to be biologically true, sens = fraction of true instances that is detected, CS = consensus score, LL = Log-Likelihood score
3) AMONGST MULTIPLE STATISTICALLY RELEVANT MOTIFS, THE MOTIF WITH THE HIGHEST LOGLIKELIHOOD SCORE IS THE BEST CANDIDATE TO BE A BIOLOGICALLY TRUE MOTIF
The Log-Likelihood score (LL) of a solution (computed and optimized by MotifSampler during motif detection) balances motif conservation with the
number of motif instances. So when different motifs reported by MotifRanking for a given dataset have a different LL score,
the motif with the higher LL score represents the one that is either better conserved or found in more sequences of the dataset (or both).
In both cases, the higher scoring motif more likely describes a biologically true motif compared to lower LL-scoring (not necessarily untrue) motifs.
This is demonstrated for 5 datasets (EvgA, FadR, GalR, GalS, NtrC in Table 3a/set-2) in which MotifRanking identified 2 different motifs :
the motif with the highest LL score (motif-1) is also the most conserved one (higher CS-score than motif-2) and indeed corresponds to the true motif.
When for a given dataset different motifs have a similar LL score (datasets MetR and RcsAB in Table 3a/set-2),
they may each describe a true motif unless one can be prioritized by another indicator such as higher consensus score (motif-2 has a higher CS and also higher sens and PPV compared to motif-1 in dataset MetR) or higher statistical significance (motif-2 has a higher RR and also higher sens and PPV compared to motif-1 in dataset RcsAB).
In absolute terms, the LL score of a detected motif in a small dataset (in which the number of true motif instances is low) can be orders lower
compared to the LL score of a detected motif in a large dataset (where the number of true motif instances is high)
while both true motifs may have a comparable degree of conservation in the respective datasets.
We demonstrate this by comparing the results for datasets PdhR and PurR (table 3b) where the true motif is equally well conserved (same order CS)
and equally well detected (same order of RR, sens and PPV) but for which the LL-score is many orders higher in the large dataset (PurR)
compared to the small dataset (PdhR). This indicates that one should be careful when comparing absolute numbers of the LL score.
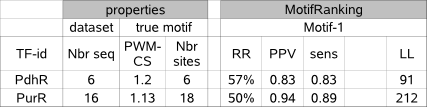
Table 3b : The LL score should not be used in absolute value to assess the reliability of a motif to be a true one.
Dataset PurR has more sequences (Nbr seq) and more true motif instances (Nbr sites) that the dataset PdhR but in both cases the true
motif is equally well conserved (PWM-CS score). The detected motif (motif-1) in both datasets is equally significant (RR)
and describes an equal fraction of true instances (both high sens) with only few unknown instances (both high PPV).
The LogLikelihood score (LL) is however very different.
4) THE RETURN RATIO (RR) IS AN INDICATOR FOR THE ACCURACY WITH WHICH A MOTIF CAN BE PREDICTED
The return ratio (RR) reported by MotifRanking is used to select candidate motifs (PWMs) that reflect overrepresented motif signals in a dataset.
We noticed that the return ratio (RR) is also correlated with the accuracy (PPV) with which a particular motif is detected by MotifSampler (Fig.3c).
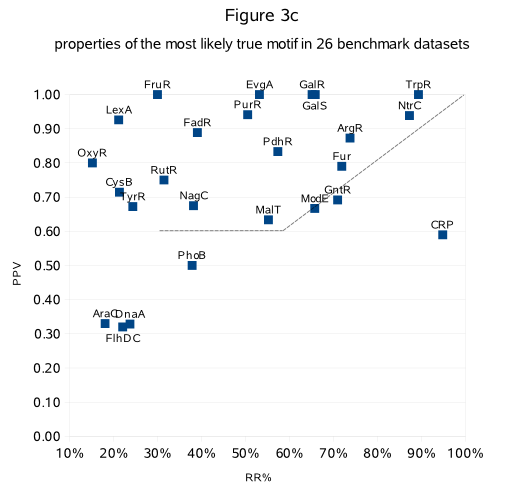
Fig.3c shows the return ratio (RR) and the positive predictive value (PPV) of the most likely true solution (highest LL and/or RR and RR>10%)
detected in 26 benchmark datasets (datasets list-2[Fis and OmpR excluded], RR and PPV extracted from archive-Table3/list-2).
We indeed observe that more strictly detected solutions (in the range RR>30%) better describe the known motif (PPV is order 0.6 or higher than RR).
For less strictly detected motifs (RR <30% in Fig.3c), the PPV cannot be predicted (can be either high or low :
in 6 datasets the known motif was well described (PPV>0.7) while in another 4 datasets the known motif was poorly described (PPV~= 0.3)).
CONCLUSION
When MotifRanking does not report any significant motif (i.e. RR<10 and/or N<10) for a given dataset
(even when repeating MotifSampler with different parameter settings that further explore the motif solution space),
one should conclude that the true motif (if so present) is not easily detectable by de novo motif detection.
We advice running MotifRanking with a stringent similarity threshold in a first attempt to summarize the results of multiple runs of MotifSampler.
Reducing redundancy in the output too much (by using a higher setting for parameter -t) will falsely increase the confidence
that a reported motif is strongly overrepresented.
If different significant motifs are reported, MotifRankings metrics (LL-score, return ratio RR and CS-score, in that order)
can be used to further prioritize the retained motifs. In general, we would only consider motif models (PWMs) with a return ratio higher
than 30% (or 50% on the safe side) as an accurate description of a candidate true motif (with minimal interference of noisy instances).
LIST DATASETS (the MotifRanking results for these datasets can be consulted in archive table3) :
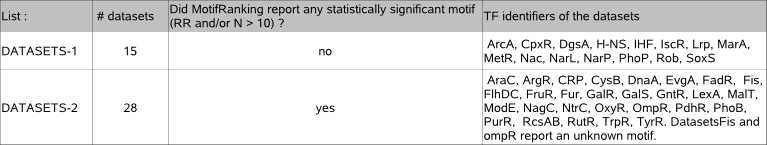
Each of the 43 datasets is added to one list depending if a significant motif was reported by MotifRanking or not.
Bookmarks:
-----------------------------
(*) See Running MotifSuite on the benchmark datasets for the parameter settings used in MotifSampler and MotifComparison.
(**) See Computation of performance indicators for definitions on Conv, N, RR, PPV, sens.
|