Inferring transcriptional module networks from ChIP-chip-, motif- and microarray data
K. Lemmens, T. Dhollander, T. De Bie, P. Monsieurs, K. Engelen, B. Smets, J. Winderickx, B. De Moor, K. Marchal
Software
Analysis of the Spellman dataset
Analysis of the Gasch dataset
Methods
Download
Software
ReMoDiscovery is an intuitive algorithm to correlate regulatory programs with regulators and corresponding motifs to a set of co-expressed genes. It exploits in a concurrent way three independent data sources: ChIP-chip data, motif information and gene expression profiles.
ReMoDiscovery can be downloaded here. Information on installation and parameters, can be found in the help file.
We also provide an example data set.
Analysis of the Spellman dataset
Table 1
Overview of the different seed modules, identified for the Spellman dataset [1]. Seed number: identifier of the seed network. P-value: the seed module p-value. Combined number: the identifier of the combined module. Function Module: the function of the seed module (see materials and methods). Regulators: regulators that are part of the seed module. Motifs: motifs that are part of the seed module. Genes: the genes that belong to the seed module.
html
txt
Table 2
Description of the seed modules that could be extended by the second step of the algorithm, the seed extension step. Seed number: identifier of the seed module. Combined number: the identifier of the combined module; Function Module: the function of the seed module (see materials and methods). Regulators: regulators that are part of the seed module network. Confirmed regulators: the regulators that were confirmed by the seed extension step. Confirmed Motifs: the motifs that were confirmed by the seed extension step. Enriched Function: for each module the fraction of genes associated with each functional category in the MIPS database was calculated and the hypergeometric distribution was used to calculate a corresponding functional enrichment p-value. The top 5 of enriched functional categories is represented in the table. The corresponding functional enrichment p-value is indicated between brackets.
html
txt
Figure
Overview of the different seed modules, identified in the seed discovery step of our algorithm for the Spellman dataset [1]. For visualisation purposes, seed modules with similar function are grouped into a 'combined module'. The function of the combined module equals the one of the composing seed modules. Regulators and motifs that are part of the regulatory program of the extended module are indicated in the figure by a bold edge from the regulator or motif to the module.
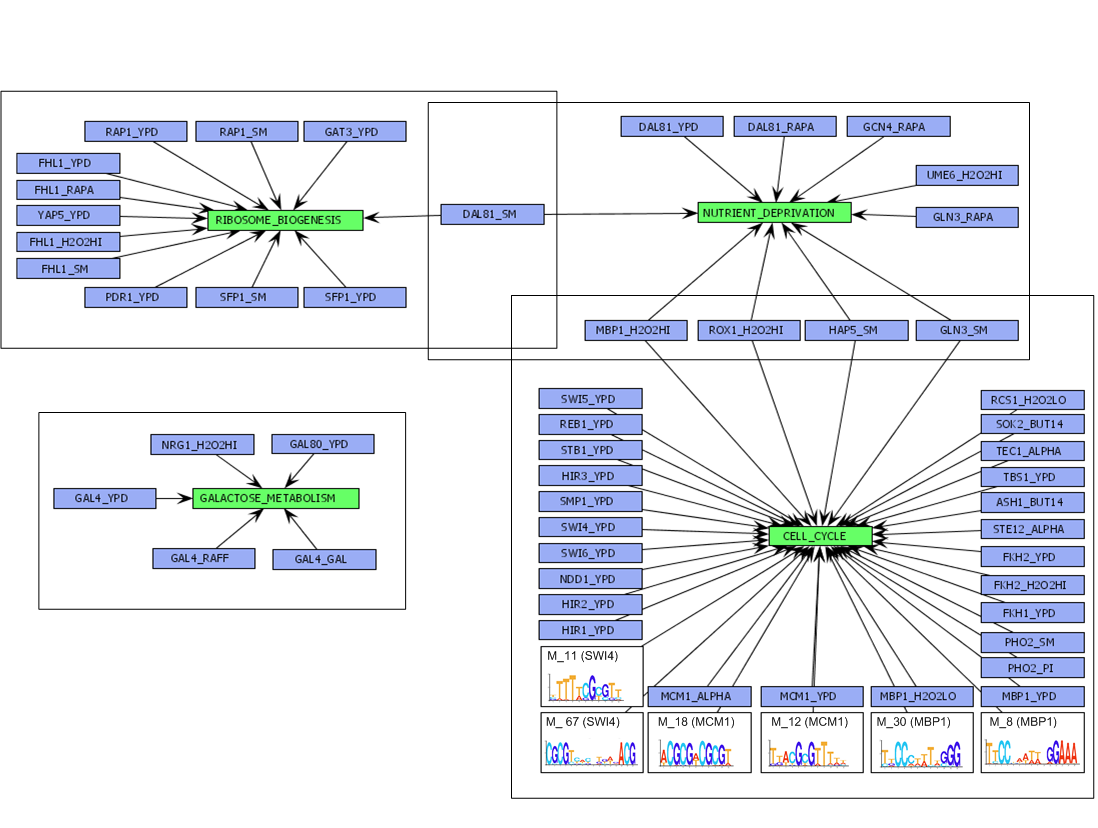
[View full size image]
Analysis of the Gasch dataset
Table 1
Overview of the different seed modules, identified for the Gasch dataset [3]. Seed number: identifier of the seed network. P-value: the seed module p-value. Combined number: the identifier of the combined module. Function Module: the function of the seed module (see materials and methods). Regulators: regulators that are part of the seed module. Motifs: motifs that are part of the seed module. Genes: the genes that belong to the seed module.
html
txt
Table 2
Description of the seed modules that could be extended by the second step of the algorithm, the seed extension step. Seed number: identifier of the seed module. Combined number: the identifier of the combined module; Function Module: the function of the seed module (see materials and methods). Regulators: regulators that are part of the seed module network. Confirmed regulators: the regulators that were confirmed by the seed extension step. Confirmed Motifs: the motifs that were confirmed by the seed extension step. Enriched Function: for each module the fraction of genes associated with each functional category in the MIPS database was calculated and the hypergeometric distribution was used to calculate a corresponding functional enrichment p-value. The top 5 of enriched functional categories is represented in the table. The corresponding functional enrichment p-value is indicated between brackets.
html
txt
Figure
Overview of the different seed modules, identified in the seed discovery step of our algorithm for the Gasch dataset [3]. For visualisation purposes, seed modules with similar function are grouped into a 'combined module'. The function of the combined module equals the one of the composing seed modules. Regulators and motifs that are part of the regulatory program of the extended module are indicated in the figure by a bold edge from the regulator or motif to the module.
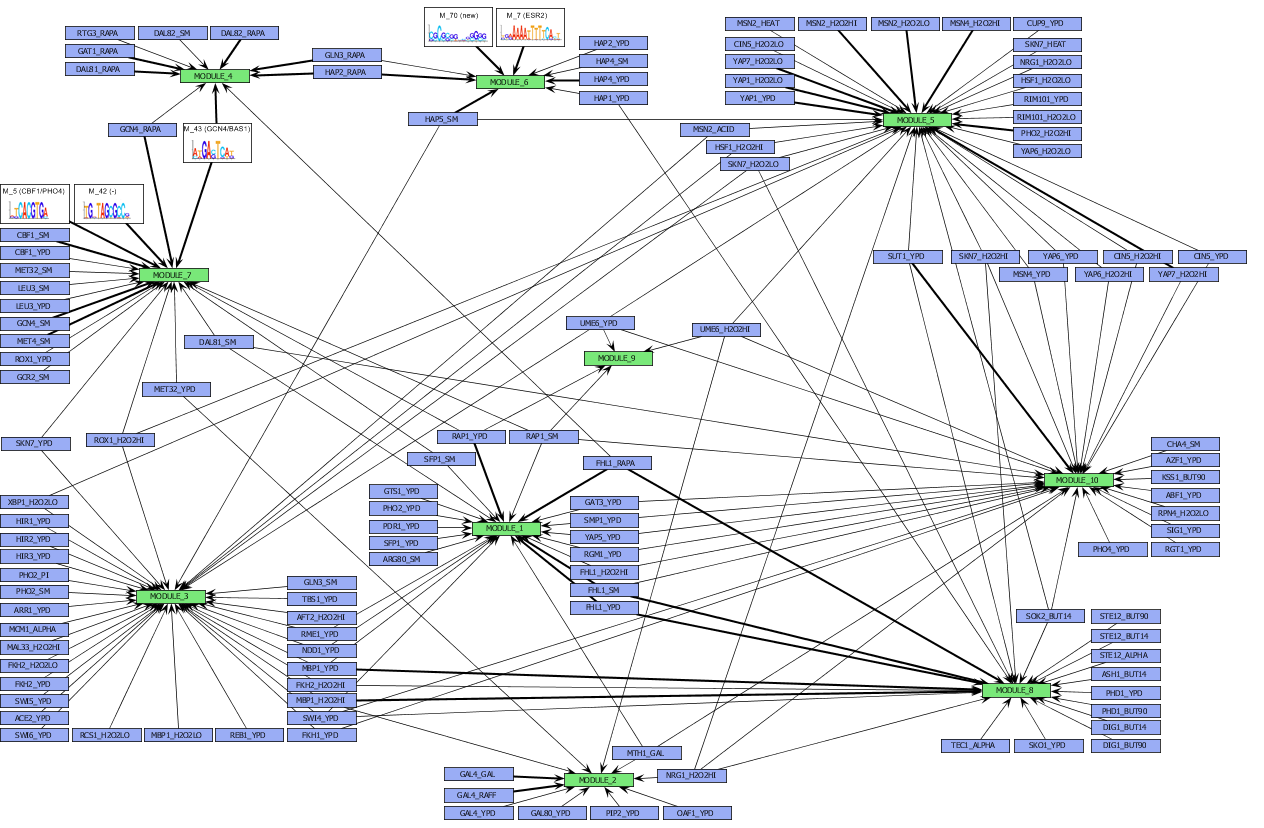
[View full size image]
Methods
Datasets
More information about the dataset can be found here.
P values
Figures showing significance scores (i.e. minus the logarithm of the seed module p-values) for seed modules found on the Spellman dataset [1] with different settings for the ChIP-chip support. These significance scores reflect the probability score in a joint distribution of the number of regulators and genes for seed modules obtained on randomized data. The size of the markers is proportional to the (logarithm of the) number of modules of a specific size, mined on the original non-randomized data. All modules with more than one gene are highly significant.
Spellman Sc=3
Spellman Sc=4
Spellman Sc=6
Spellman Sc=8
Spellman Sc=10
Figures showing significance scores (i.e. minus the logarithm of the seed module p-values) for seed modules found on the Gasch dataset [2] with different settings for the ChIP-chip support. These significance scores reflect the probability score in a joint distribution of the number of regulators and genes for seed modules obtained on randomized data. The size of the markers is proportional to the (logarithm of the) number of modules of a specific size, mined on the original non-randomized data. All modules with more than one gene are highly significant.
Gasch Sc=4
Gasch Sc=6
Gasch Sc=8
Gasch Sc=10
Parameter sensitivity
Figures showing the significance of the similarity in module content between ReMoDiscovery seed modules at different parameter settings. Significance was calculated using a normalized Jaccard similarity score: the color bar on the right indicates the number of standard deviations from the mean of the distribution. These plots indicate the parameter sensitivity of the ReMoDiscovery algorithm. More details on the calculation of the normalized Jaccard scores can be found here.
Figure 1
Influence of variations in ChIP-chip threshold on gene content
Figure 2
Influence of variations in ChIP-chip threshold on regulator content
Figure 3
Influence of variations in ChIP-chip support on gene content
Figure 4
Influence of variations in ChIP-chip support on regulator content
Figure 5
Influence of variations in correlation threshold on gene content
Figure 6
Influence of variations in correlation threshold on regulator content
Comparison of ReMoDiscovery with GRAM
Figures showing the significance of the similarity in module content between the ReMoDiscovery seed modules and GRAM output at different parameter settings. Significance was calculated using a normalized Jaccard similarity score: the colorbar on the right indicates the number of standard deviations from the mean of the distribution. More details on the calculation of the normalized Jaccard scores can be found here.
Regulator content similarity ReMoDiscovery-GRAM
Figure 1
varying ReMoDiscovery ChIP-chip threshold and GRAM core profile p-value cutoff.
Figure 2
varying ReMoDiscovery ChIP-chip threshold and GRAM module p-value cutoff.
Figure 3
varying ReMoDiscovery ChIP-chip threshold and GRAM num in core cutoff.
Figure 4
varying ReMoDiscovery ChIP-chip support and GRAM core profile p-value cutoff.
Figure 5
varying ReMoDiscovery ChIP-chip support and GRAM module p-value cutoff.
Figure 6
varying ReMoDiscovery ChIP-chip support and GRAM num in core cutoff.
Figure 7
varying ReMoDiscovery correlation threshold and GRAM core profile p-value cutoff.
Figure 8
varying ReMoDiscovery correlation threshold and GRAM module p-value cutoff.
Figure 9
varying ReMoDiscovery correlation threshold and GRAM num in core cutoff.
Gene content similarity ReMoDiscovery-GRAM
Figure 10
varying ReMoDiscovery ChIP-chip threshold and GRAM core profile p-value cutoff.
Figure 11
varying ReMoDiscovery ChIP-chip threshold and GRAM module p-value cutoff.
Figure 12
varying ReMoDiscovery ChIP-chip threshold and GRAM num in core cutoff.
Figure 13
varying ReMoDiscovery ChIP-chip support and GRAM core profile p-value cutoff.
Figure 14
varying ReMoDiscovery ChIP-chip support and GRAM module p-value cutoff.
Figure 15
varying ReMoDiscovery ChIP-chip support and GRAM num in core cutoff.
Figure 16
varying ReMoDiscovery correlation threshold and GRAM core profile p-value cutoff.
Figure 17
varying ReMoDiscovery correlation threshold and GRAM module p-value cutoff.
Figure 18
varying ReMoDiscovery correlation threshold and GRAM num in core cutoff.
Comparison of ReMoDiscovery with SAMBA
Figures showing the significance of the similarity in module content between the ReMoDiscovery seed modules and SAMBA output at different parameter settings. Significance was calculated using a normalized Jaccard similarity score: the colorbar on the right indicates the number of standard deviations from the mean of the distribution. More details on the calculation of the normalized Jaccard scores can be found here.
Gene content similarity ReMoDiscovery-SAMBA
Figure 1
varying ReMoDiscovery correlation threshold and SAMBA overlap prior.
Download
Remodiscovery can be download here.
References
1. Spellman PT, Sherlock G, Zhang MQ, Iyer VR, Anders K, Eisen MB, Brown PO, Botstein D, Futcher B: Comprehensive identification of cell cycle-regulated genes of the yeast Saccharomyces cerevisiae by microarray hybridization. Mol Biol Cell 1998, 9:3273-3297.
2. Harbison CT, Gordon DB, Lee TI, Rinaldi NJ, Macisaac KD, Danford TW, Hannett NM, Tagne JB, Reynolds DB, Yoo J et al.: Transcriptional regulatory code of a eukaryotic genome. Nature 2004, 431:99-104.
3. Gasch AP, Spellman PT, Kao CM, Carmel-Harel O, Eisen MB, Storz G, Botstein D, Brown PO: Genomic expression programs in the response of yeast cells to environmental changes. Mol Biol Cell 2000, 11:4241-4257.