back
Concerning the selection of pairwise conserved sequences (AVID-VISTA), the parameters L and C define the minimal length and degree of conservation for a region to be considered pairwise 'conserved'. Changing these parameter values resulted in detecting the same, (strongly conserved) regions. However, with lower parameter settings, instead of finding one large conserved region, the region was split into several smaller subpieces, matching the corresponding longer one. Different parameter settings were evaluated. The settings that resulted in the longest collinear regions were selected, since they reduce the complexity of the clustering in the subsequent step of the analysis flow.
|
human |
chimp |
mouse |
rat |
dog
|
| human |
/ |
85%
350 nt |
85%
200 nt |
85%
200 nt |
80%
200 nt
|
| chimp |
85%
350 nt |
/ |
85%
200 nt |
85%
200 nt |
80%
200 nt
|
| mouse |
85%
200 nt |
85%
200 nt |
/ |
85%
350 nt |
80%
200 nt
|
| rat |
85%
200 nt |
85%
200 nt |
85%
350 nt |
/ |
80%
200 nt
|
| dog |
80%
200 nt |
80%
200 nt |
80%
200 nt |
80%
200 nt |
/
|
For the clustering step, we assessed the effect of the parameters I and P on the composition of the resulting clusters.
The inflation parameter I regulates the granularity and determines the size of the clusters (i.e. the number of sequences within the resulting clusters). This parameter did not have a major effect on the resulting clusters and was fixed at 4.
The other cluster parameter, P, is a similarity measure, determining the minimal similarity (i.e. the percent identity between two sequences) needed to group sequences together. To optimize this parameter, runs using different values of P were performed. The similarity measure P was adapted to the degree of phylogenetic relatedness between the organisms from which the pairwise compared sequences originated. Clustering was performed using either the same similarity threshold C as in the previous VISTA selection step, or by using less stringent criteria (subtracting 5%, respectively 10% from the conservation selection criterion C). For a given data set, these tests thus resulted in three sets of clusters: one for threshold (P) score C%, one for C-5% and one for C-10% (as stated, I was kept constant at 4).
Dependent on the parameters used, a cluster set consisted of multiple small and tightly related clusters, or few large clusters. The large clusters contained weaker conserved subsequences, obtained by less stringent relations between the mammalian subsequences (e.g. lower percent identity). Because these clusters also contained subsequences that were not significantly homologous, the parameter set resulting in the smallest clusters was selected as input for motif detection. To determine the optimal setting of P, the quality (~size) of the clusters was evaluated for different values of P for each data set separately. The parameter settings that resulted in the most tightly linked clusters for each data set, were chosen for motif detection.
| Gene (a) |
P (b) |
I (c) |
# clusters (d) |
# el largest cluster (e)
|
| cfos |
0 |
4 |
12 |
5
|
| hoxb2 |
-10 |
4 |
4 |
6
|
| pax6 |
0 |
4 |
20 |
6
|
| scl |
-10 |
4 |
11 |
4
|
| EGR3 |
0 |
4 |
11 |
8
|
| GSH1 |
-10 |
4 |
12 |
4
|
| HIV-EP1 |
0 |
4 |
13 |
6
|
| HOXB5 |
0 |
4 |
1 |
4
|
| MEIS2 |
0 |
4 |
24 |
6
|
| PCHD8 |
0 |
4 |
14 |
4
|
(a) Name of data set; (b) similarity parameter and (c) inflation value parameter used to generate these set of clusters; (d) number of clusters in the chosen set and (e) the number of subsequences in the largest cluster.
With the exception of the threshold on the consensus score, default parameter values were used to run the BlockSampler algorithm. The threshold itself was fixed at 1.2 to ensure that only initially well-conserved motifs were extended in length. Analysis that would require longer (shorter) and less (stronger) conserved blocks can be done by lowering (augmenting) this parameter value.
To select the most promising hits from the output of BlockSampler, we designed a score that is independent of block sequence length, but increases with the degree of conservation of the motifs. This normalized consensus score is appropriate because short motifs have a higher chance of resulting in a high consensus score. Normalization was done by recalculating the consensus scoring according to the following formula:
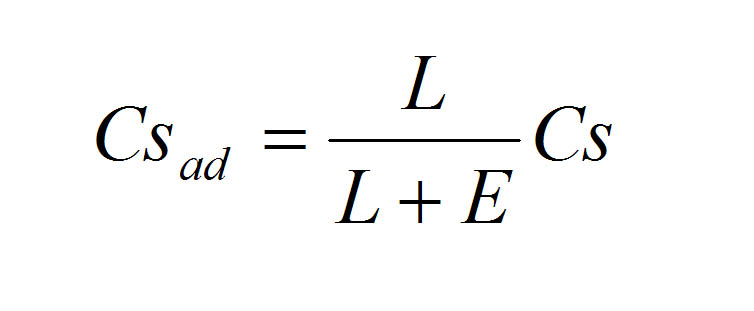
Where L is the length of the conserved block, E is an empirical factor and Cs is the consensus score. As a result, the normalized consensus score is not proportional to block sequence length.
Different empirical factors were tested on different data sets, and 5 appeared to give the best balance between motif length and conservation. Again, depending on the interest of a particular study, the empirical factor can be enlarged to favor larger blocks.
back